Report
Report | Student mental health in 2025: Patterns of mental health inequality among diverse student populations
12 August 2026
This report examines student mental health in the UK in 2025 using data from the Student Academic Experience Survey (SAES). It also draws on earlier survey waves to track changes since 2017.
The findings show that student mental health remains a growing concern. In 2025, 18.9% of students reported a mental health difficulty, up from 17.9% in 2024 and 6.1% in 2017, and mental health remains the leading reason students consider dropping out of university, ahead of financial difficulties.
The report also identifies widening inequalities between student groups. In 2025, 26% of students from the lowest-participation areas (POLAR quintiles 1 and 2) reported a mental health difficulty, compared with 19% of those from the highest-participation areas (quintiles 4 and 5). State-educated students were also 41% more likely to report difficulties than privately-educated students.
Students are also working substantially more than they were in 2020, and the 2025 data shows a stronger association between the number of hours worked and the likelihood of reporting a mental health difficulty.
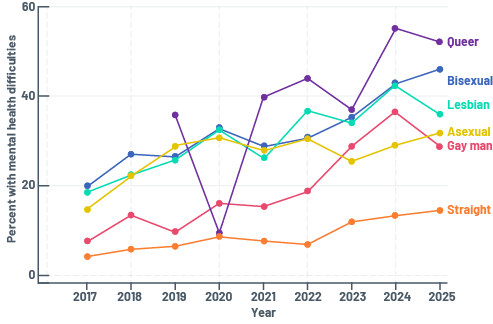
LGBTQ+ students continue to report substantially higher rates of mental health difficulties than their peers. In 2025, 52% of queer students and 46% of bisexual students reported difficulties, compared with 14% of straight students. Across the period from 2021 to 2025, trans students were more than twice as likely to report mental health difficulties as cisgender students. Non-binary students also reported particularly high rates, with 46% experiencing mental health difficulties in 2025, although the sample sizes for trans and non-binary students were relatively small.
Female students remain more likely to report mental health difficulties than male students, and the gap between the two groups has widened over time. Differences were also evident by ethnicity. In 2025, mixed-ethnicity students recorded the highest rate among the ethnic groups examined, at 27%, compared with 22% of white students.
The project explored:
The report calls for urgent action from higher education providers, healthcare providers and the government to support student mental health and address widening inequalities between different groups of students.
The Policy Institute at King’s College London works to solve society’s challenges with evidence and expertise. We combine the rigour of academia with the agility of a consultancy and the connectedness of a think tank. Our research draws on many disciplines and methods, making use of the skills, expertise and resources of not only the institute, but the university and its wider network too.
TASO is an independent hub for the higher education sector, providing evidence and resources to help reduce equality gaps guidance to ensure that everyone has the opportunity to access, succeed and thrive in higher education. To eliminate equality gaps, we need firstly to know what works to support students from underrepresented and disadvantaged backgrounds and then to equip higher education providers to act on this knowledge. We want to see the sector making evidence-informed decisions that support students to access, succeed in and progress from higher education. Through research and evaluation, we are building and mobilising the evidence base to foster equality in higher education.
Several groups are referred to in this document. Statistical analysis is poorly suited to capturing the unique experiences of individuals. However, learning from groups of individuals and their experiences allows us to identify and understand the common issues, challenges and triumphs that form the tapestry of people’s lives.
In this paper we will use the term LGBTQ+ to refer broadly to all people who self-identify in any, and any combination, of the terms that this group covers. We recognise that different people may mean different things by some of these terms, and for simplicity, we take the steer given to us by the survey participants themselves, and their understanding. The majority of the analysis in this paper is split along the lines of the questions asked in the Student Academic Experience Survey (SAES), and sexual orientation is therefore considered separately from whether someone identifies as trans/transgender. While we recognise that the experience of being gay and trans is likely to differ from that of being straight and trans, the sample sizes currently available do not allow analysis at this level. We hope that as sample sizes increase with the addition of more years of data, we will be better able to conduct this form of analysis.
In this paper, we may sometimes exclude certain groups from analysis due to small sample sizes, or aggregate multiple groups together. Where we do this, we will use a version of the LGBTQ+ acronym that captures the groups to whom we (and our findings) refer at that point. The survey has separate questions on sexual orientation and gender identity. We analyse these separately in this paper, and use the acronym LGBQA when referring to sexual orientation only, in line with the survey questionnaire.
Michael Sanders is a Professor of Public Policy at King’s College London’s Policy Institute. His research has three main strands: the use of causal methods and particularly randomised trials to evaluate policy interventions; the use of behavioural science in policy design; and increasing social mobility and opportunity. Michael has previously served as the founding Chief Executive of What Works for Children’s Social Care, and Chief Scientist at the Behavioural Insights Team, where he has led diverse teams of researchers, policy specialists and practitioners to improve outcomes for vulnerable people in the UK and overseas.
Julia Ellingwood is a Research Fellow at King’s College London’s Policy Institute and a PhD student in the School for Government at King’s. She draws on her past experience as a teacher to inform approaches to research with vulnerable groups and is trained on culturally responsive teaching and research methods. She has also contributed to publications on policy interventions for vulnerable groups as well as methodological approaches in social policy. She holds a Master of Public Policy from the Hertie School, Berlin.
For the last few years, King’s College London has partnered with Transforming Access and Student Outcomes in Higher Education (TASO), the Higher Education Policy Institute (HEPI), and Advance HE, to analyse data from the Student Academic Experiences Survey (SAES), investigating student mental health and wellbeing.
This report, and its predecessors, reflects a growing awareness of, and efforts to improve, mental health across society, and specifically among students and young people. There is increasing evidence that mental health difficulties are rising among young people in the UK, even when improvements in awareness and diagnosis are taken into account (Blanchflower, 2024; McGorry, 2025; Lewis, 2025). For example, in recent years there has been a reversal of a decades-long trend of declining suicides, particularly, but not exclusively, among young men (Office for National Statistics, 2024).
Alongside this, voluntary sector-provided support for acute mental health needs has been curtailed or put at risk, for example with the closure of the Nightline Association (Endacott, 2025), which provided quality assurance and umbrella support for dozens of university-based mental health listening services; and there have also been dramatic changes announced by the Samaritans (Buchanan, 2025). With the continuing financial challenges faced by the higher education sector, it is more important than ever that resources are deployed effectively and are directed to where they will make the most difference.
Evidence shows that undertaking higher education is generally a positive move for young people, with substantial benefits financially, personally and socially. Recent research has shown that very few students come to regret the decision to go to university (Duffy, 2025). Nonetheless, higher education providers have a responsibility to ensure that their students thrive and succeed while studying. Our previous reports, which show substantial differences in mental health among students from different demographic and socioeconomic groups, suggest that not only is there inequity in people’s experience, but that efforts to widen participation could be under threat. This year’s report continues that analysis.
This is our third consecutive year of publishing analysis of student mental health findings in the SAES (Sanders, 2023; Sanders 2024), and while this year’s report can be read standalone, we do reference and build on previous findings. By continuing to track survey data from thousands of students each year for several years, we hope to understand the demand for services better, understand who is struggling most, and use this information to better inform how best to help.
The SAES, conducted by Advance HE and HEPI, has collected data on undergraduate students’ wellbeing since 2006, and data on mental health difficulties since the 2016/17 academic year. The survey asks questions about students’ subjective wellbeing, as well as their lives on and off campus. A more detailed description of the methodology used in the survey itself can be found in the main reporting on the analysis (Neves, 2025).
Survey data collection for 2025 took place between January and March 2025. For consistency, we report years in the way that the data is presented in the SAES. For example, 2025 refers to the wave collected during the winter/spring of 2025; that is, during the 2024/25 academic year. Looking back at previous data collection waves, it should be noted that the 2020 data refers to the period prior to the major onset of the Covid-19 pandemic, and the 2021 data refers to the period after almost a year of various lockdown restrictions.
The survey was designed and developed in partnership between Advance HE and HEPI, with online fieldwork interviews independently conducted by Savanta, and further responses provided by Torfac. Savanta’s Student Panel (formerly YouthSight) is made up of over 48,000 undergraduate students in the UK. These students are primarily recruited through a partnership with the Universities and Colleges Admissions Service (UCAS), which invites a large number of new first-year students to join the panel each year.
The median completion time for the 2025 survey was 9 minutes 52 seconds.
We have data on students’ mental health for nine waves of the SAES data, starting from 2016/17 and continuing to the most recent academic year. In that time, there have been 103,444 respondents, of which 12,412 reported having mental health difficulties. The demographic make-up of the sample is described in Table 1. As shown, the composition of the sample varies from year to year, with some groups featuring more prominently in one year than others.
The survey sample is large, with the response rate being around 10% each year. This data is not necessarily representative of the student population, as some groups are more likely to respond than others. However, this unrepresentativeness is not expected to change over time. Weighting respondents based on their proportion in the student population does not meaningfully change the implications of our findings.
This data is weighted based on the proportions found in the university population as identified in data from the Higher Education Statistical Agency (HESA) for ethnicity, gender, year of study, and domicile. As such, the sample as analysed has the same proportions as the true population. Some unrepresentativeness may remain in the data as weights are not available for people’s LGBTQ+ identities, which form a key part of our data below, and where there appears to be oversampling in particular of people with trans identities.
Table 1: Sample sizes in the SAES, by year and demographic group.
First, we are interested in what has happened to students’ mental health over time, going back to 2017 (see Figure 1).
Figure 1: Proportion of UK undergraduates reporting mental health difficulties (2017 to 2025).
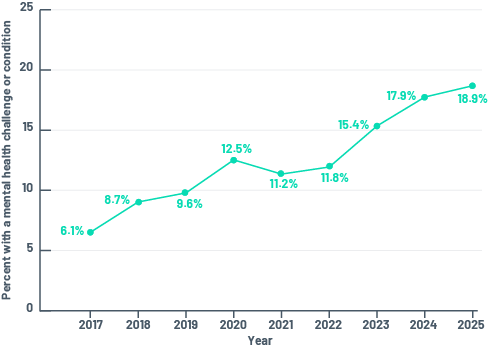
As in previous years, we are continuing to see a rise in mental health difficulties over the period covered by the data. Comparing this year’s data with last year’s, there has been an increase of 5.5% (17.9% in 2024 to 18.9% in 2025). The increase between 2024 and 2025 is lower than the 16% increase seen between 2023 and 2024, which suggests a slight levelling off, and this year’s increase is not statistically significant at conventional levels (p<0.069). Nonetheless, the rate has risen by 210% since 2017, revealing a statistically significant pattern of increasing mental health difficulties.
It is difficult to identify any one specific driver of increasing mental health challenges. Sources speculate on reasons (supported by varying levels of evidence) including pandemic-related lockdowns, economic fallout from Brexit, the ubiquity of social media and smartphone technology, climate grief, anxious parenting styles, and delayed independence (Fonagy, 2025).
These possible reasons, among others, merit further investigation, though it is not unreasonable to assume that the cumulative effect of these pressures on students is the driver of poor mental health. It should be noted, however, that student mental health challenges were rising before the onset of the pandemic and the subsequent cost-of-living crisis, and that they continue to rise year-on-year. Therefore, simply waiting for the numbers to come down as the impact of the pandemic recedes is probably optimistic.
Here we consider who experiences mental health difficulties, and whether there are any inequalities across groups of students.
In our previous research we found that female students have, on average, lower wellbeing than their male counterparts, although this is reversed for doctoral students. How, then, does the incidence of mental health difficulties vary according to gender identity?
Figure 2 shows the average incidence of mental health difficulties among students whose gender identity is male, female or non-binary during the period covered by the data (i.e. all years are pooled).
Figure 2: Average incidence of reported mental health difficulties among UK undergraduates, by gender identity (2022 to 2025).
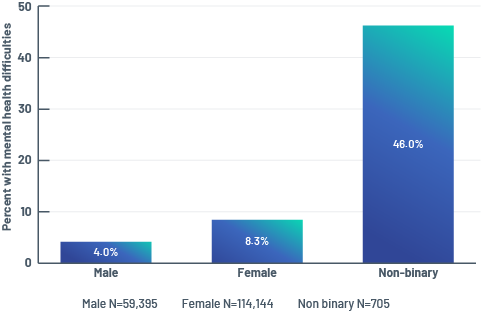
As we can see, there are substantial differences between groups, in line with the data in previous surveys. The gap between non-binary students on the one hand, and male and female students on the other, is substantial, and while non-binary students make up a small group comparatively (132 respondents in 2025 out of the full sample of 10,232), the difference remains striking.
The gap between female and male students is also substantial. These gaps are both statistically significant and have widened slightly in the pooled data, with female students reporting mental health difficulties increasing a full percentage point and male students increasing by less than half a percentage point, compared with last year.
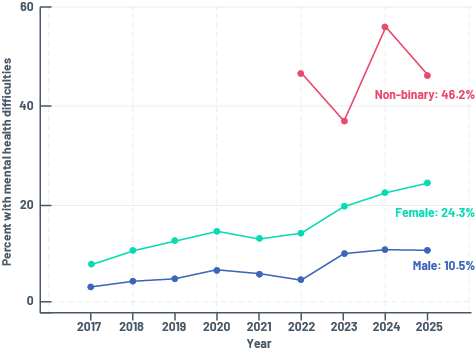
We also looked at how mental health difficulties among different gender identities have changed over time. Figure 3 shows that while there has been a rise in mental health difficulties for all students over the period covered by the data, male and female students are diverging. The rate of female students with mental health difficulties has increased by an average of 0.75 percentage points more per year than male students. This difference is statistically significant, particularly as there has been relatively flat rates of mental health difficulties seen in male students over the last three years.
Although the small sample sizes mean we should be cautious about over-interpretation, there has been a decrease in the proportion of non-binary students experiencing mental health difficulties in the last year, falling below 50%. This year-on-year change is not statistically significant due to the small number of non-binary students in the data.
Figure 3: Proportion of UK undergraduates reporting mental health difficulties, by gender identity (2017 to 2025).
The SAES data is unusual in its richness when it comes to students’ sexual orientation and trans status. Unlike many other surveys, this data does not treat LGBTQ+ people as a monolithic group; there are enough lesbian, gay, bisexual, asexual, queer and trans students represented in the sample to allow each group to be analysed separately.
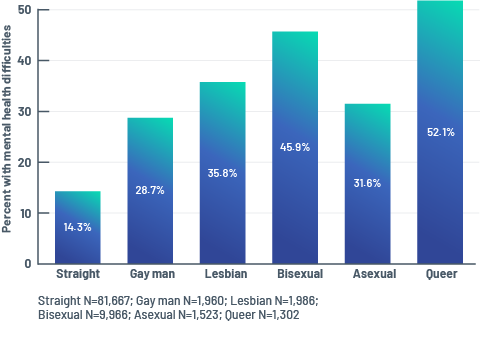
Figure 4 shows the average incidence of mental health difficulties for each sexual orientation group within the 2025 data. As we can see, the incidence of mental health challenges is markedly higher in all LGBQA groups than in the ‘Straight’ group.
Queer people have the highest levels of mental health difficulties among the identified groups, with significantly higher incidence than bisexual people, who have the second highest (although the relatively small number of queer-identifying students means this should be interpreted with caution). Bisexual people have a significantly higher incidence of mental health difficulties than lesbians, who have the third highest levels. In contrast with our wellbeing analysis, we find that asexual people have significantly better mental health outcomes than bisexual people or lesbians. However, gay men fare significantly better than other LGBQA groups on this measure, although gay men still have higher levels of mental health difficulties than straight people overall.
Figure 4: Average incidence of reported mental health difficulties among UK undergraduates who identify as LGBQA or straight (2025).
If we look at changes over time, as shown in Figure 5, there is a general pattern of increasing mental health difficulties. Again, the acceleration of these difficulties is more pronounced among LGBQA people, with lesbians and gay men experiencing a rise in mental health difficulties at three times the rate of straight people, and bisexual and asexual people at around double the rate of increase.
In 2025, more than half of queer-identifying students and more than a quarter of all other LGBQA groups reported having mental health difficulties, compared with one in seven straight students; this is despite a slight reduction in the rates among lesbians and gay men.
Figure 5: Proportion of UK undergraduates reporting mental health difficulties among those who identify as LGBQA or straight (2017 to 2025).
Turning to trans people, Figure 6 shows that they are more than twice as likely to experience mental health difficulties while studying than cisgender people, a difference which is statistically significant.
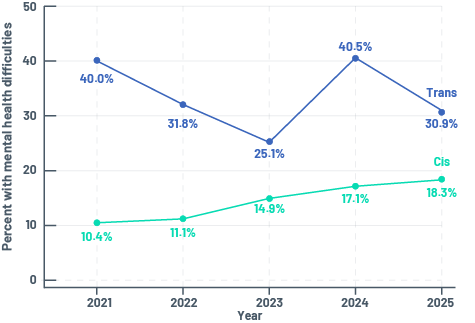
Although people’s trans status has been captured for less time than their sexual orientation (only since 2021), and trans people make up a smaller proportion of the sample than LGBQA people, it is still worthwhile considering the trends in the data (see Figure 7).
Last year we reported that a previous decline in mental health challenges among trans students had been reversed, which was concerning. However, this year, we see a more positive picture, with a significant (9 percentage points) reduction in mental health challenges among trans students (albeit this returns us to 2022 levels, which was previously the second worst year for which we have data for mental health difficulties among trans people). Overall, it appears that the gap between cisgender and trans students may be narrowing, but this is mostly driven by an increase in mental health difficulties among cisgender students.
Figure 6: Average incidence of reported mental health difficulties among UK undergraduates who identify as cisgender or trans (2021 to 2025).
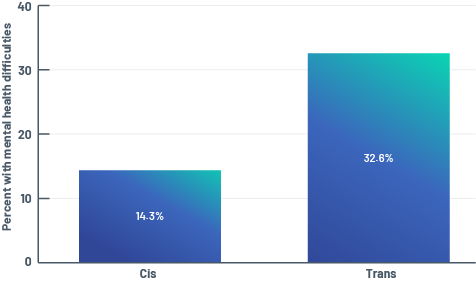
Figure 7: Proportion of UK undergraduates reporting mental health difficulties among those who identify as cisgender or trans (2021 to 2025).
Next, we look at ethnicity. Ethnicity data is broken down into most of the Office for National Statistics (ONS) categories, but omits some. It should also be noted that ethnicity is only reported for UK domiciled students (that is, international students are not presented here). These results are broken down at the finest level of granularity that is possible with the data.
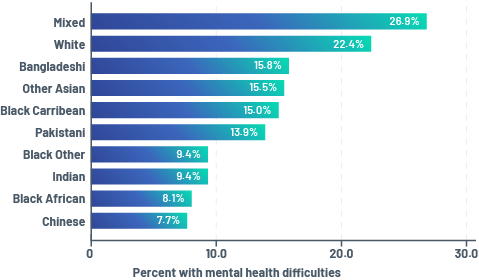
As we have seen in previous years, the data suggests that reporting of mental health difficulties follows a different pattern to disadvantage in wider society in relation to race, in that those students in the ‘White’ ethnic group generally have worse mental health than other ethnicities, with the exception of students in the ‘Mixed’ ethnic group, who experience higher (but not significantly so) levels of mental health challenges (see Figures 8 and 9).
The differences between 2024 and 2025 are also interesting. There has been a decline in mental health challenges among ‘Black African’, ‘Black Other’, ‘Indian’ and ‘Pakistani’ students, and a significant rise among ‘White’ and ‘Mixed’ ethnicity students, with one in five and one in four students experiencing mental health difficulties, respectively. ‘Mixed’ ethnicity students are shown to be experiencing significantly more mental health difficulties than ‘White’ students, for the first time. This finding is in line with a recent systematic review by Oh and colleagues (2024), which found that multiracial individuals have higher levels of mental ill health than other ethnicities, and that ‘racial discrimination and ethno-racial identity may shape mental health trajectories of multiracial people’.
Figure 8: Average incidence of reported mental health difficulties among UK undergraduates, by ethnicity (2017 to 2025).
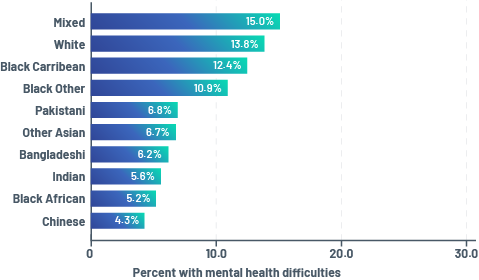
Figure 9: Average incidence of reported mental health difficulties among UK undergraduates, by ethnicity (2025).
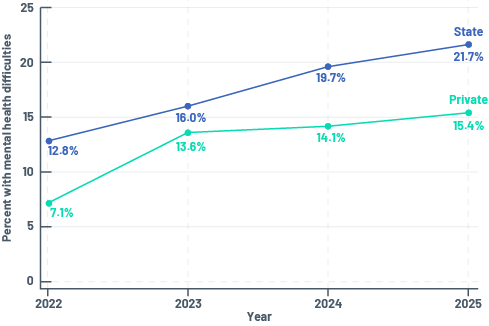
We now look at students’ educational background and how this is associated with their mental health. In particular, we examine whether attending state or private school is associated with them experiencing a mental health difficulty. Prior to this analysis, it was difficult to anticipate which direction this relationship would be expected to go; while those who attended state schools are, on average, less affluent than those who attended private schools, those from private schools have access to more resources that might make them more aware of any mental health challenges they are experiencing, and might make it easier for them to get a formal diagnosis.
Figure 10 shows that students who attended state schools have, on average, worse mental health than their peers who attended private schools, with a rate approximately 30% higher, on average, over the time period. This difference is statistically significant. Looking at the trends over time, we find that the gap has widened in the last year from 5.5 percentage points to 6.3 percentage points, although because of increases in mental health challenges in both groups, the proportionate difference has only risen from 39% higher in 2024 to 41% higher in 2025.
Figure 10: Average incidence of reported mental health difficulties among UK undergraduates who attended private or state schools over time (2022 to 2025).
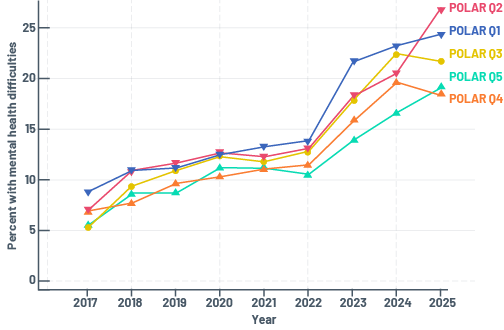
There is no perfect indicator of a student’s socioeconomic background or class, either in our data, or in general. To investigate the relationship between class/background and mental health, we therefore use POLAR quintile, which is whether the home address of a student is in an area where the most (POLAR quintile 5) or least (quintile 1) young people go on to enter higher education.
Figure 11 shows the relationship between POLAR quintile and mental health, and how this has changed over time. This shows that mental health was only very weakly associated with POLAR quintiles until 2022, after which it has diverged substantially, with POLAR Q1 and Q2 now significantly above Q4 and Q5.
Figure 11: Average incidence of reported mental health difficulties among UK undergraduates, by POLAR quintile (2017 to 2025).
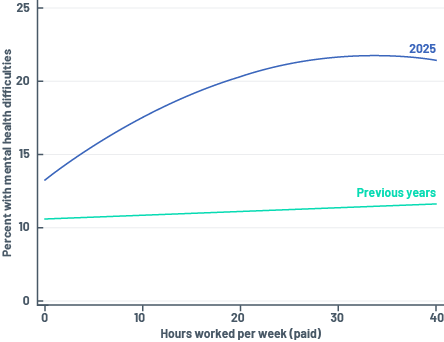
In this section, we look at students’ experiences of higher education and how this is associated with their mental health, starting with paid work around their studies. We look at this in two ways. In Figure 12, we show: the relationship (fitted with a curve) between weekly hours worked and reported mental health difficulties for 2025; and all previous years, pooled.
In previous years, this relationship has largely been inclining, albeit gently. In 2025, however, we find a much stronger relationship between hours worked and student mental health difficulties, particularly at the lower levels of hours worked. The association begins to level off when students work more than 30 hours a week.
Figure 12: Relationship between average number of weekly hours worked during term time and reported mental health difficulties among UK undergraduates, 2025 versus previous years.
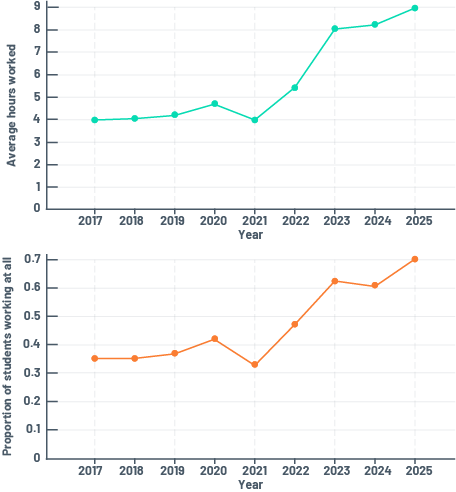
This finding may reflect a changing relationship between work and mental health, or a change in the number and type of students who are working those hours. Figure 13 shows that the average number of hours students work per week has approximately doubled since 2020, largely driven by a 75% rise in the proportion of students who are working.
Figure 13: Number of hours worked on average by students, and proportion of students working more than zero hours a week on average, over time (2017 to 2025).
One of the primary concerns relating to poor mental health among students is the potential for disrupting (or ending altogether) their studies, which could have wide-ranging impacts on future outcomes. Having considered the prevalence of mental health challenges across different identities, backgrounds and situations, we now examine how poor mental health is translating to thoughts of dropping out of university.
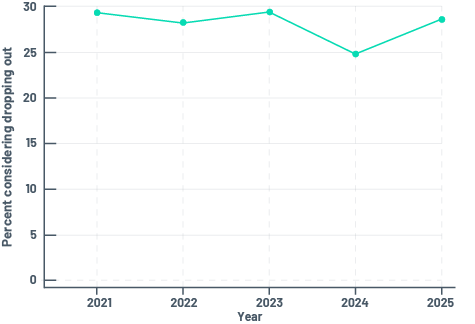
To consider this, we looked at two questions asked within the SAES: whether a student has considered dropping out of university, and if they have, what the main reason for this is. These questions have been asked only in the last five waves of the SAES, to a total of 51,042 students, of which 14,356 said they have considered dropping out of university; 28.1%, or just over one in four.
As can be seen in Figure 14, the reduction in dropout consideration we saw in 2024 has been largely reversed in 2025. Even so, recent research from HEPI and King’s College London shows that very few students ultimately regret having attended university (Duffy, 2025).
Figure 14: Proportion of UK undergraduates who report considering dropping out of university (2021 to 2025).
We also looked at the reasons students cite for considering dropping out, both in absolute levels, as well as the changing prevalence of mental health as a reason over time. As seen in Figure 15, poor mental health is by far the most common main reason someone considered dropping out of university – more than 20 percentage points more than any other explanation (among the 18 options available). This is broadly consistent over time in the data.
Figure 15: Main reasons given by UK undergraduates for considering dropping out of university (2021 to 2025).
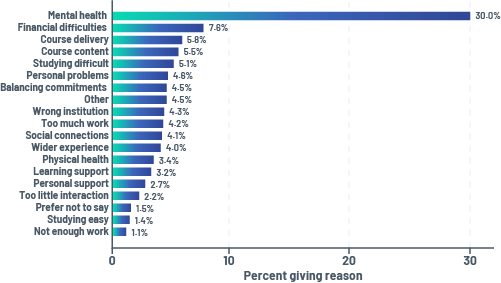
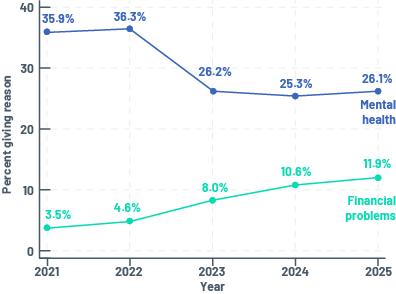
Figure 16 shows how this has changed over time and we see a dip in the most recent figures in mental health being given as the reason for considering dropping out. As we might expect, there has been a notable rise in the rate at which financial distress has been given as the main reason for considering dropping out. This has continued into 2025, although it remains a less significant reason compared with mental health. These two reasons are of course interlinked, and participants can only give one response as their ‘main’ reason for considering dropping out.
Figure 16: Proportion of UK undergraduates who select mental health difficulties or financial problems as the main reason for considering dropping out of university (2021 to 2025).
In this report, we have considered the state of student mental health in 2025, looking at the overall levels of mental health difficulties, how these differ across key demographics and how this has changed over time. We have focused on updating our findings in a similar report published in 2024, making use of an additional year’s data.
As in previous years, we have used the SAES, a large survey dataset that gives unparalleled richness of understanding of students’ academic experiences. The data is not perfect and it is necessary to caveat our findings with the fact that some of them may in part be driven by issues in sampling, particularly in uncovering reasons for why students may drop out.
Nonetheless, there is cause for concern: the proportion of students with mental health difficulties has more than tripled in the last six years, from 6% in 2017, when the data were first collected, to nearly 19% in 2025. There has been a 5.5% rise in the last 12 months, continuing an already troubling trend.
As we have described previously, this trend predates the pandemic and the cost-of-living crisis, and so neither factors can be said to be solely driving the continuing increase. Despite a return to comparatively stable inflation, the increase in mental health challenges continues.
The inequalities around who is experiencing mental health challenges have persisted this year, with widening gaps across most demographics, and little cause for optimism. Students from lower socioeconomic backgrounds, who previously experienced mental health challenges at roughly the same rate as their peers, have diverged considerably over recent years. This year’s data seems to show both increasing mental health challenges among those who work, and a worsening relationship between the number of hours worked and the likelihood of experiencing a mental health challenge; and a rise in the number of students working. This suggests that universities and the government should consider what can be done to ease the financial pressure on students, particularly those from lower income backgrounds.
The story is not simply one of finance and income, however. This year, for the first time, students with a mixed ethnic background are significantly more likely to experience mental health challenges than their white peers, in an exacerbation of a prior trend. Students across the LGBTQ+ spectrum, and female students, also continue to experience higher rates of mental health challenges than straight, cisgender and male students.
Taken together, this analysis suggests that action is urgently needed by higher education providers, by healthcare providers, and by the government to support the mental health of students.
Universities are the lifeblood of many communities, as well as a critical driver of economic growth; a key mission of the Labour government. As universities continue to work to combat an inauspicious financial environment for the sector, they must at the same time work to safeguard and protect their students’ mental health. Supporting universities in doing this critical work is more important than ever.
Blanchflower, D. G., Bryson, A. & Bell, D. N. F. (2024). The Declining Mental Health of the Young in the UK. National Bureau of Economic Research. https://www.nber.org/papers/w32879.
Buchanan, M. (2025 July 25). Samaritans to close more than 100 branches. BBC. https://www.bbc.co.uk/news/articles/cm2l23ylv46o.
Duffy, B. & Hillman, N. (2025). UK Higher Education: Public perceptions vs reality. The Policy Institute and HEPI. https://www.kcl.ac.uk/policy-institute/assets/higher-education-perceptions-vs-reality.pdf.
Endacott, K. (2025 February 5). Nightline Association announces closure. Nightline Services to continue nationwide. [Press release]. https://web.archive.org/web/20250327224703/https://nightline.ac.uk/nightline-association-announces-closure-nightline-services-to-continue-nationwide/.
Fonagy, P. (2025 January 27). Understanding the crisis in young people’s mental health. The Health Foundation. https://www.health.org.uk/features-and-opinion/blogs/understanding-the-crisis-in-young-people-s-mental-health.
Lewis, J. & Stiebahl, S. (2025). Student Mental Health in England: Statistics, policy, and guidance. House of Commons Library. https://researchbriefings.files.parliament.uk/documents/CBP-8593/CBP-8593.pdf.
McGorry, P., Gunasiri, H., Mei, C., Rice, S. & Gao, C. X. (2025). The youth mental health crisis: analysis and solutions. Frontiers in psychiatry, 15, 1517533. https://doi.org/10.3389/fpsyt.2024.1517533.
Neves, J., Freeman, J., Stephenson, R. & Rowan, A. (2025). Student Academic Experience Survey 2025. Advance HE. https://www.hepi.ac.uk/wp-content/uploads/2025/06/SAES-2025_FINAL_WEB.pdf.
Office for National Statistics. (2024). Suicides in England and Wales: 1981 to 2024. https://www.ons.gov.uk/peoplepopulationandcommunity/birthsdeathsandmarriages/deaths/bulletins/suicidesintheunitedkingdom/2024registrations.
Oh, H., Winn, J. G., Verdugo, J. L., Bañada, R., Zachry, C. E., Chan, G., Okine, L., Park, J., Formigoni, M. & Leaune, E. (2024). Mental health outcomes of multiracial individuals: a systematic review between the years 2016 and 2022. Journal of Affective Disorders, 347, 375–386. https://doi.org/10.1016/j.jad.2023.11.040.
Sanders, M. (2023). Student mental health in 2023. TASO and the Policy Institute. https://taso.org.uk/libraryitem/report-student-mental-health-in-2023-who-is-struggling-and-how-the-situation-is-changing.
Sanders, M. & Ellingwood, J. (2024). Student mental health in 2024: How the situation is changing for LGBTQ+ students. TASO and the Policy Institute. https://taso.org.uk/libraryitem/report-student-mental-health-in-2024-how-the-situation-is-changing-for-lgbtq-students.