Blog20 August 2024

There are few, if any, bigger days in the year for the higher education sector than A-level results day. For hundreds of thousands of students, results day boils down all the learning, dedicated study, and late nights into a few headline numbers.
And while underneath each university or college acceptance lies a deeply personal story, reflecting on the bigger picture gives the sector an opportunity to examine how much progress has been made in the last year. Handily, UCAS statistical releases give us an opportunity to dive into the data and do so.
One area of particular interest to TASO and much of the wider sector is the disparity in progression to higher education between disadvantaged students and their non-disadvantaged peers. Historically, students from more disadvantaged backgrounds have been much less likely to go to university or college.
The story behind the numbers
A look at the headline result indicates at first glance that as a sector we’ve achieved the result we were after: the number of disadvantaged students going to university or college has increased from 2023 and is the highest on record. It is a worthy celebration that more students from deprived areas than ever before have secured a place at university or college.
This is true both when we look at IMD Quintile 1 and POLAR 4 Quintile 1, both commonly used, but quite different, measures of disadvantage. Both measures have their strengths and their weaknesses (for example, both have biases in relation to various characteristics including gender, ethnicity and single-parent households). But here we focus on IMD as it is more suited for measuring socio-economic disadvantage than POLAR4 (see the Sutton Trust’s report on measuring disadvantage for more detail).
Over 44,000 18-year-olds from the most deprived areas in the UK (IMD Quintile 1) will go to university or college.
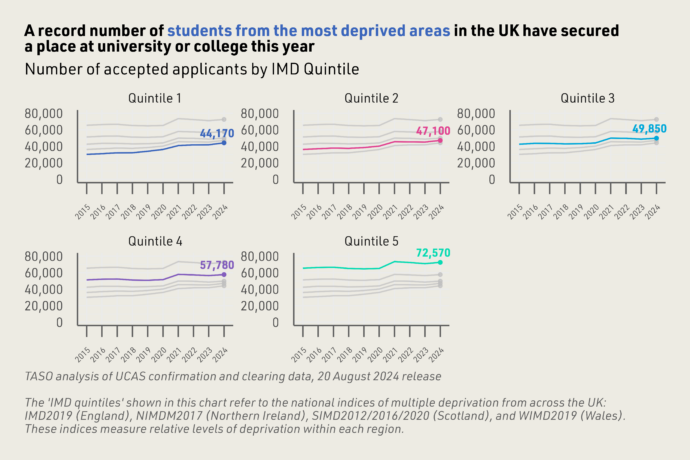
TASO analysis of UCAS confirmation and clearing data
But to stop here would be akin to looking at the first grade on your A-level results and promptly putting it back in the envelope and rushing off to celebrate. While it is positive news that more disadvantaged students are going to university or college, raw numbers alone like this do not tell the full story. Entry rates (number of accepted applicants divided by estimated student population), can give us some more insight, by looking at the proportion of students going to university or college.
When we look at entry rates, our findings still look like a positive grade, but perhaps not the one we were hoping for as we jumped in the car to drive to school and pick up our results. The entry rate for the most disadvantaged students is up from 25% in 2023 to 26% in 2024. But unlike the number of accepted applicants, it has not surpassed its highest ever level.
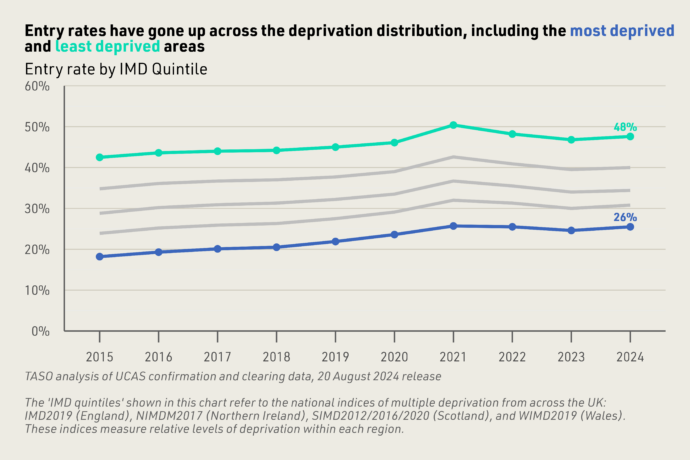
TASO analysis of UCAS confirmation and clearing data
Addressing the entry gap
To get a greater understanding of how the dial has moved on inequity in higher education, we can look at the entry rate gap: the difference in entry rates between the most disadvantaged and least disadvantaged students.
We can think of this as the final, decisive grade at the bottom of our results paper. And here, the results are a little more disappointing. The entry rate gap still sits at 22 percentage points, a gap that hasn’t noticeably changed on last year, and is an improvement of only 2 percentage points since 2015. A gap of this size indicates that despite increasing access numbers and entry rates, disadvantaged students remain far less likely to enter higher education than their more affluent peers.
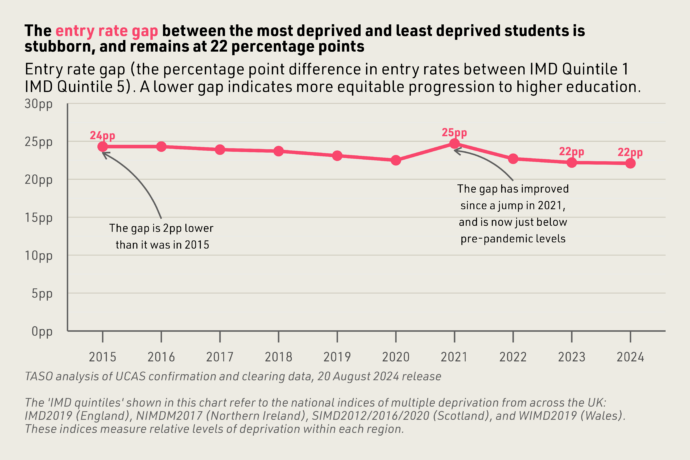
TASO analysis of UCAS confirmation and clearing data
Much like the hard work and emotional investment of a student will never be fully reflected in exam results, this data cannot entirely capture the dedication of practitioners, evaluators, and students themselves to creating a more equitable higher education landscape.
But what the data does capture is that there is still a long way to go to reduce these inequitable outcomes.
And much like receiving a disappointing exam result, our attitude as a sector should not be to bemoan the difficulty of the problem, but to reaffirm our efforts and go again for the next year, in the hope that when we tentatively open our results, we will have even more cause for celebration.
You can find the code behind this analysis on TASO’s GitHub page.